December 24, 2016
“Stay wary, alert and very, very nimble.”
– Art Cashin Managing Director, UBS Financial Services
I read Art’s letter almost every day and, boy, do I enjoy his wit, his compassion and his brains. In the spirit of Christmas, his post this morning was fun.
‘Tis three days before Christmas and at each brokerage house The only thing stirring was the click of a mouse
Down on the Exchange the tape inches along Brokers bargained and traded as they hummed an old song
The Fed turned data dependent or so they would claim Yet they hiked in December though the data looked tame
He touched on the Cubs, the Broncos and LeBron… my favorite part was:
Don’t let this year’s problems impede Christmas Cheer Resolve to be happy throughout the New Year
And resist ye Grinch feelings let joy never stop Put the bad at the bottom keep the good on the top
So count up your blessings along with your worth You’re still living herein the best place on earth
And think ye of wonders that light children’s eyes And hope Santa will bring you that Christmas surprise
With joy on our minds and hope in our hearts, let us step forward and not let the bond market tear us apart. Sorry about that… Art’s jingle is in my head.
I’m on record saying the low in bonds is IN. I continue to believe we are entering a phase of rising interest rates. In such environments, bonds perform poorly. It’s starting to get dicey globally and the evidence is showing up in the bond market. Let’s see what is going on that may or may not be fully “on your radar.” This from Wolf Richter, founder of Wolf Street:
“All kinds of things are now happening in the world of bonds that haven’t happened before. For example, authorities in China today halted trading for the first time ever in futures contracts of government bonds, after prices had swooned, with the 10-year yield hitting 3.4%. Trading didn’t resume until after the People’s Bank of China injected $22 billion into the short-term money market.
What does this turmoil have to do with US Treasurys? China has been dumping them to stave off problems in its own house….”
The move won’t be straight up though it has felt that way over the last few months. If you are long government bonds (including longer-dated municipals), my two cents is to use rallies (declines in interest rates) to shorten your maturity exposures.
The biggest bubble of all bubbles sits in the government bond market. Particularly in the developed world… here, there and everywhere. Governments’ choices? Inflate the problem away, raise taxes, and sell assets or default. Or all of the above. Right now it is inflate and seek growth. Currency gamesmanship or more pointedly “currency wars” steps into the fray. The imbalances are great.
I believe we will see a sovereign debt default first in Europe. The EU is improperly bolted together and protectionism is on the rise. Brexit is a sign. The U.S. election is a sign. The Italian Referendum is a sign. And we are seeing serious problems with government debt emerge outside of the U.S.The European Central Bank now owns 15% of Germany’s national debt. Much of it at negative yields. The ECB remains on its bond buying spree though they are running out of positive yielding bonds to buy.
Further, the ECB is buying up the troubled debt from the books of the troubled banks and there appears to be a long way to go. Troubled isn’t just the higher risk junk bond corporate bets, trouble are the sovereign government bonds from Greece, Italy, Portugal and Spain. I can’t help but think we will one day look back and reflect on just how surreal, crazy, insane this period turned out to be.
Here in the U.S. the Fed now owns $2.4 trillion of the roughly $20 trillion in U.S. government debt. In Japan, retirees are no longer buying Japanese government bonds. When Abe came to power, the private sector held 177% of the debt-to-GDP. They now own approximately 75%. The citizens are selling. The BoJ steps in — print and buy… the Bank of Japan owns more of the debt than the private sector. Print and buy… the Japanese Central Bank owned 60% of the nation’s ETFs as of June 2016.
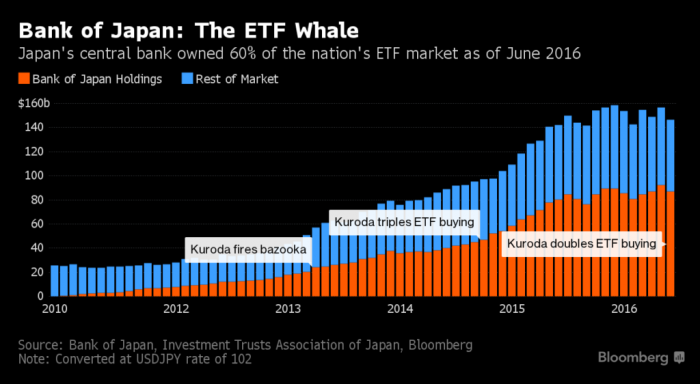
See Bloomberg’s The Bank of Japan’s Unstoppable Rise to Shareholder No. 1
In 2016, Japan joined Europe in the great experiment of modern monetary policy: negative interest rates to spur inflation. Will it work? In the short term, yes; in the long term, I don’t think so.
That’s the bet you and I are faced with. With rates still near 5,000-year lows, the risk reward makes zero sense to me. We are dependent on central bankers. I’m nervous.
OK… as depressing as that sounds, it need not be. There is an upside and it is this: I believe we are heading towards an investment opportunity of a lifetime. To get there, play more defense than offense. Look at valuation levels, look at the age of the bull market move. Have a plan in place to risk protect what you’ve got. I favor trend following and for now the equity market trend remains bullish.
Participate and protect and keep the great Sir John Templeton in the back of your mind. The single best advice I ever received was in 1985. Mr. Templeton told me (and of course many others many times since) that the secret to his success was he was able to: “[b]uy when everyone else was selling and sell when everyone else was buying.”
Watch out for over confidence, don’t follow the masses. This is a game of opposites. Don’t fall into the buy-and-hold forever trap. Most can’t do it. Put stop-losses in place. Use the 200-day moving average rule to stop-loss protect your equity exposure and/or buy 15% out-of-the money put options to hedge your exposure.
Further, watch what is going on in Europe. Watch China, watch Japan. Debt is the global issue. All are trying to grow out of the mess. Odds are rough. The U.S. is by no means healthy from a debt-to-GDP perspective, but we look to be the cleanest shirt in the laundry pile.
When confidence in governments is lost, the money will run to where it is treated best. That is likely to be U.S. stocks. A melt up in prices and valuations? Maybe. I hope so but I’m going to make sure I am risk minded along the way.
Heat up that coffee and find your favorite chair. I’ve included a Pension Fund Red Ink chart for you this week so you can see just how underfunded your particular state is (most recent available data). Also, keep what is happening in the U.S. Treasury bond market front of mind. You’ll find a great article (charts) to that end below.
Most importantly, celebrate your family, hug your kids and take an extra second to send some love to the world. Please know how grateful I am that you take time to read my commentary each week.
Merry Christmas and Happy Holidays to you and those you love most! I’m going to take the week off next week and recharge for the New Year.
Pension Fund Red Ink
Last week I shared with you that the California Public Employees Retirement System, better known as CalPERS, stated that a 7.5% annual return is no longer realistic. To which I added, finally, amen, right on. The new actuarial target is 7%. That still seems high to me.
Forward 10-year probable returns for equities are in the 3% to 4% range. Hussman is projecting negative 12-year coming returns. Jeremy Grantham and his team at GMO sees seven-year coming returns even lower. Note the -3% real returns for large cap stocks and -2.3% for small cap stocks (real means returns after inflation).
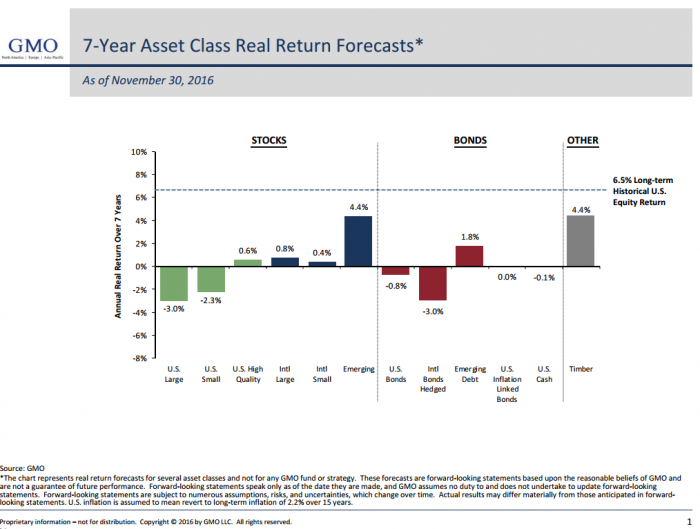
And with bonds yielding 2.5%? Bonds will get us 2.5% over the coming 10 years. Timber and Emerging Markets at 4.4%.
The headwind to that now 7% actuarial return target? High valuations and low yields. Unless the pension funds are the world’s greatest market timers, which they are not, 7% is not going to happen.
I believe 5% to 6% is doable. Smart beta and other factor-based ETFs. But hedge your equity exposure as a lot of the ammo in the central bank arsenal has been spent. The next recession, and it’s coming, will be more challenging that most. Too, the largest recession driven corrections occur when your starting point is one of excessively high valuations.
With valuations at the second highest in history, it is wise to play defense now and get more aggressive later. In the meantime… patience.As I reread last week’s piece, I found myself upset with myself for not sharing this next chart.To that end, I was curious about my state and you may be curious about yours. I’ll be talking to Susan about moving to Florida before Pennsylvania hikes the tax rate…
Here’s a look:
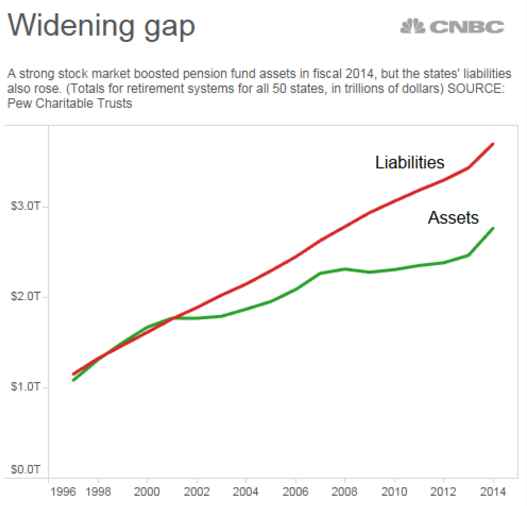
After years of not setting aside enough money, state pension funds are looking at a $1 trillion shortfall in what they owe workers in benefits, according to a new analysis from The Pew Charitable Trusts.
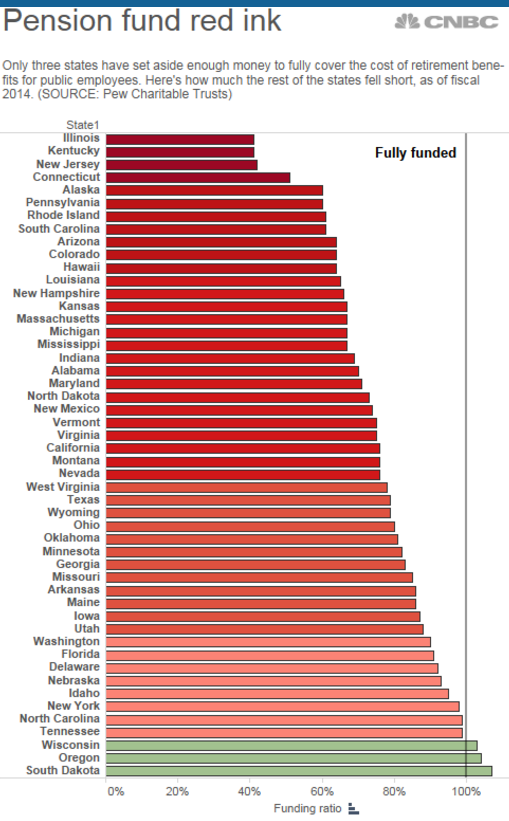
Pennsylvania is sitting at approximately 68% funded. The sixth worst state in the Union. Illinois and Kentucky are near 45% funded.
This is a mess, my friend. And it is worse than the above chart reflects. Recall from last week’s piece that CalPERS lowered their return assumptions from 7.5% to 7%. The underfunded numbers above are using 2014 return assumptions. Lower the return assumptions and the underfunded problem grows worse.
Note in the next chart that at the end of 2014, 54.9% in the fixed income and cash allocation bucket has not done so well YTD.
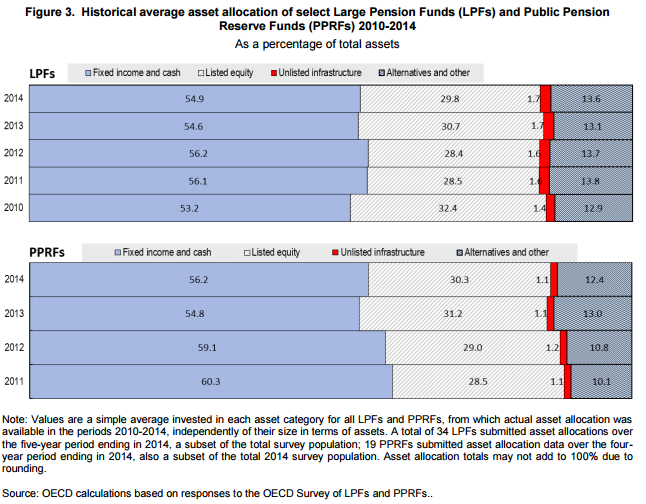
Widening gap: The data in the next chart is through fiscal year 2014. The funding gap is expected to top $1 trillion in fiscal 2015 (we’ll get that number soon). Further, with an estimated 55% in bonds, 30% in stocks and 15% in alts, my back of the napkin math looks like a 5% 2016 return year for pensions.
That bond portion of pension portfolios has been hit hard while the stock portion has gained approximately 10%. So take 55% of the 2.19% YTD return for “BND” (Vanguard Total Bond Market ETF), 30% of 9.77% for “SPY” (SPDR S&P 500 ETF) and 15% of 7% (a rough estimate for alternative investments) and you get roughly 5%.
All in, it’s a pretty safe guess that the funding shortfall is higher today than it was in 2014. The aging population and returns under the 7.5% actuarial targets are the culprits. Expect higher taxes in the more troubled states.
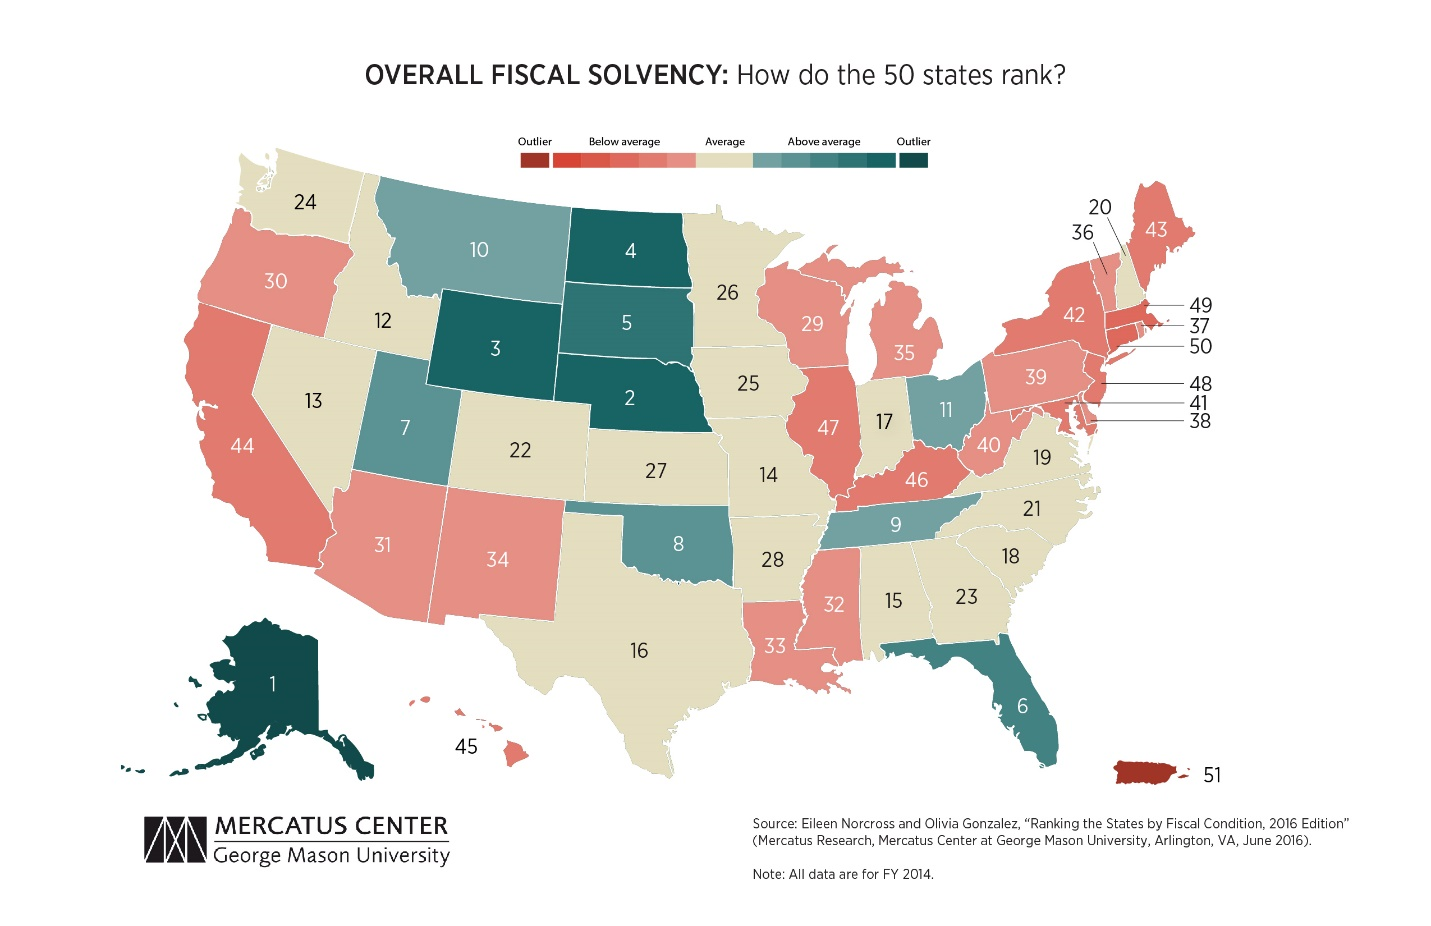
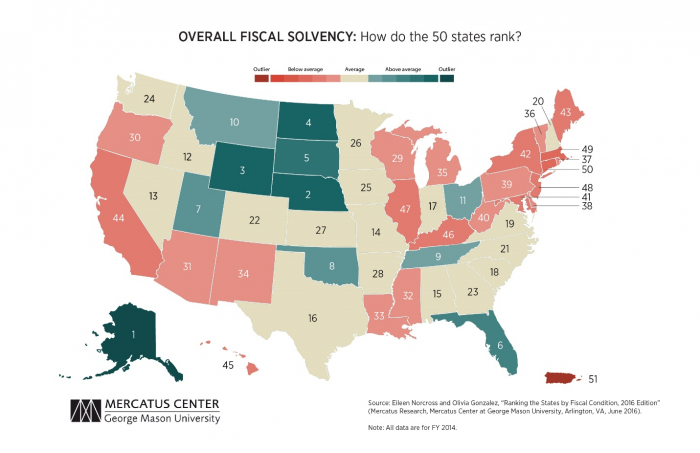
One last chart on the subject:
A ranking of the 50 states and Puerto Rico based on their fiscal solvency in five separate categories:
- Cash solvency. Does a state have enough cash on hand to cover its short-term bills?
- Budget solvency. Can a state cover its fiscal year spending with current revenues, or does it have a budget shortfall?
- Long-run solvency. Can a state meet its long-term spending commitments? Will there be enough money to cushion it from economic shocks or other long-term fiscal risks?
- Service-level solvency. How much “fiscal slack” does a state have to increase spending if citizens demand more services?
- Trust fund solvency. How much debt does a state have? How large are its unfunded pension and healthcare liabilities?
Source: Mercatus Center at George Mason University
 Source: Steve Blumenthal: Pension Fund Red Ink – Check Out Your State